Introduction
As an LSU alumni, Aaron Nola has long been said to be at his best in blistering hot weather. Many writers and Phillies fans believe that warm, muggy weather meaningfully improves his pitching performance. I wanted to see if I could find any evidence for this belief.
Here is a graph looking at Nola’s career FIP by month:
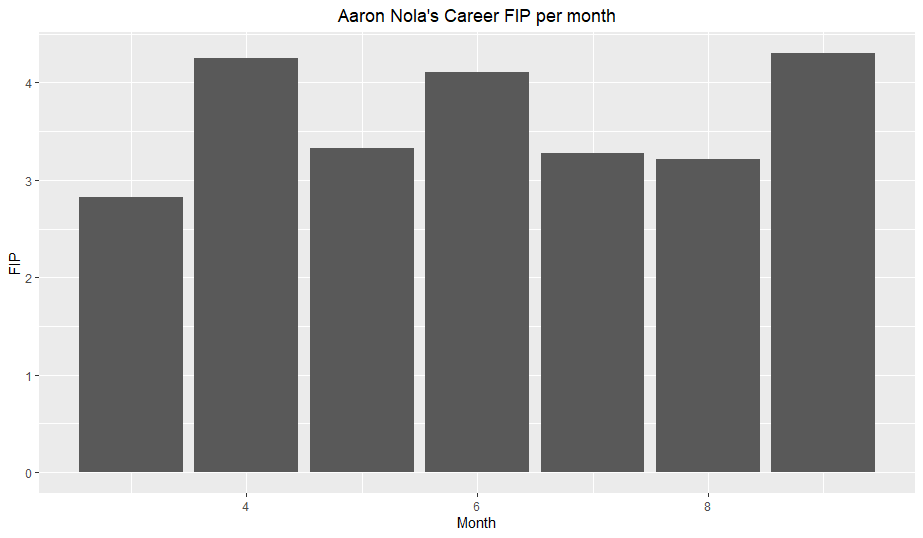
This should be a decreasing bar graph if the belief said earlier is true, as temperature rises through the baseball season. However, temperature can fluctuate significantly within a month so for this study, I will be doing a deeper dive into the game-by-game weather data.
Methodology
As in my previous inquiry, I used R and RStudio. I focused in on two weather factors; temperature and relative humidity. I am no meteorologist, but my understanding of relative humidity is that it is a measure of the total amount of humidity possible at a certain temperature. Because it isn’t reliant on temperature like absolute humidity, I can use it as an independent variable from temperature. If Nola really does pitch better during hot and humid weather, one would expect his best games occur when both temperature and relative humidity are very high.
As I said earlier, I decided to look at weather data on a game-by-game basis rather than monthly stretches. I used to two main sources for finding my weather data: Retrosheet and the Riem package. I do not have any webscraping skills (yet), so I used the Retrosheet gamelogs’ DayNight variable to estimate the times in a similar method to this study. If it was a day game, I approximated the start time as 1 PM local time and for a night game, 7 PM. My weather data was based on these approximate start times, using the temperatures and relative humidities measured closest to the start times. The Riem package has a function, riem_measures(), that returns all weather data measured at a given airport over a stretch of dates. I found the closest airport for each ballpark Nola pitched in and used the airport code to acquire the data.
To measure the quality of each start, I used Tom Tango’s Game Score Version 2.0. via FanGraphs’ gamelogs. I also looked at Nola’s average curveball spin rate from Baseball Savant in each start to see if the weather played a role there.
Important Note: I only looked at data from the 2015 through 2018 seasons, as Retrosheet has not released its 2019 Gamelogs yet.
For more info on my methodology, check out my code here. My code is full of my thought process, so any further questions you have will probably be answered there. If not, feel free to comment and I will answer as soon as possible.
IMPORTANT QUALIFIER ON WEATHER DATA
The riem package gets its data from the Iowa Environmental Mesonet. However, after cross-referencing some of my data points with Weather Underground, I found significant differences in temperature. I made a function to add the weather data to my overall data, so I first checked if an error in my function was leading to the data differences. My function would find the temperature and humidity of at the time closest to my estimated game start time. I checked several of my data points to make sure my function was getting the data from the closest time. These checks were all fine. This means that the Iowa Mesonet data simply varies from Weather Underground data. I don’t know if this is due to different measurement locations, altitude, etc., but I think this variation is an important qualification to my results, as I don’t know how trustworthy this data is. Also, for clarity, I did not use Weather Underground data because, as I said earlier, I have not learned how to webscrape and the rwunderground package no longer works.
Results
Before getting into my actual graphs, here is a sample graph:
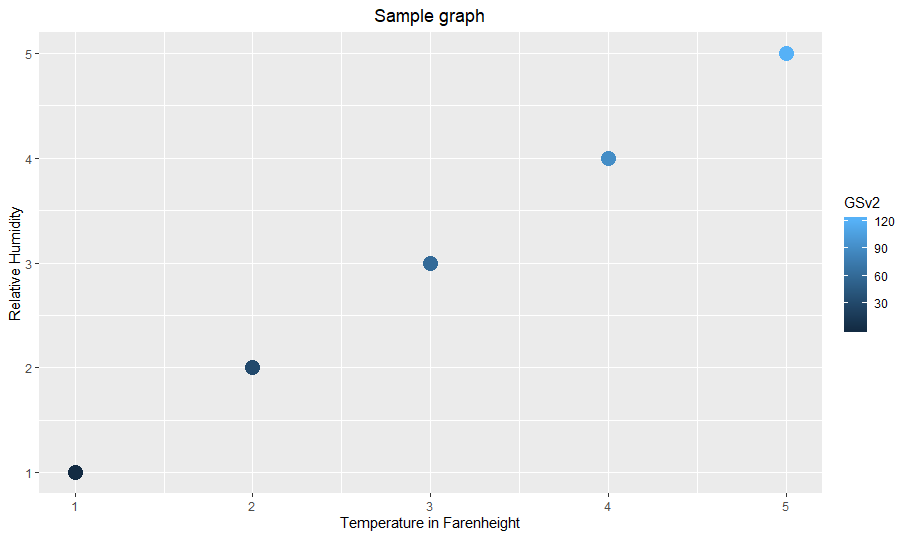
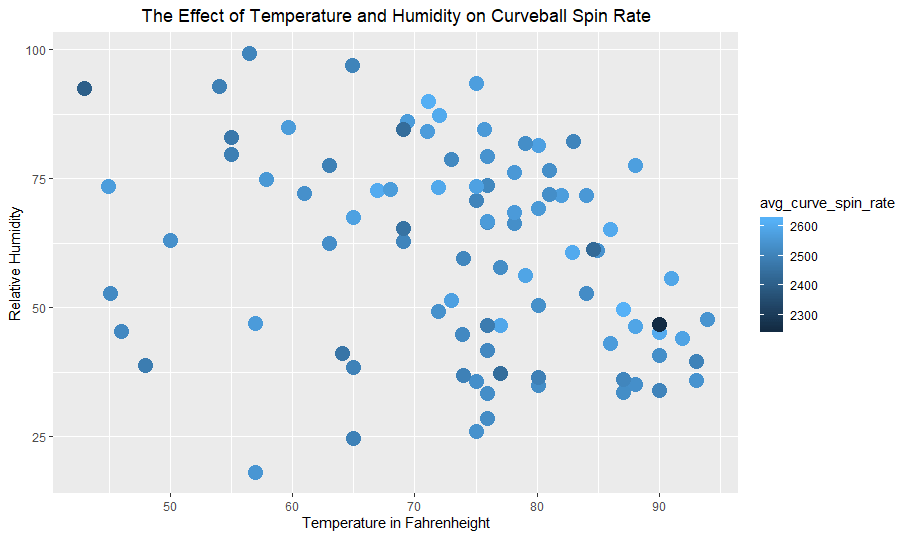
This graph is just meant to give a general idea of what the data “should” look like if Nola actually does pitch better in certain weather conditions. Obviously, temperature and relative humidity are independent so they shouldn’t be assumed to have a linear relationship, and the units of the axes are way off, but that isn’t the goal of this graph. Each point has a color corresponding to an individual game score. The lighter the shade of blue, the higher the game score. So, if humidity and temperature do help Nola, we should expect values to be very light in the upper right corner and very dark in the lower left corner (i.e. high temp + high humidity implies higher game scores). Now, for the actual graphs.
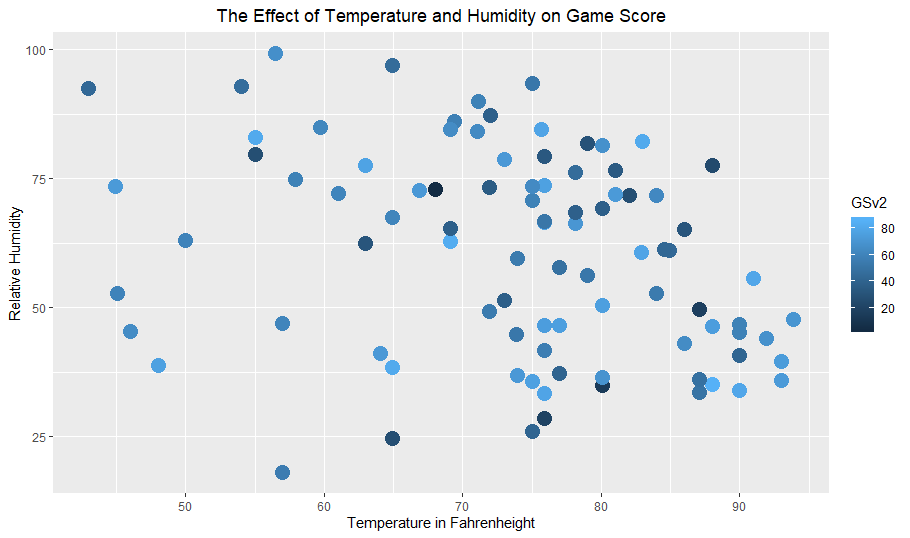
Looking at the three variable graph, I do not see much of a trend. The light colored points do not seem to cluster anywhere, except in the bottom right corner. This would imply Nola performs best in non-humid but hot climates, but this observation is not strong enough for me to seriously believe this.
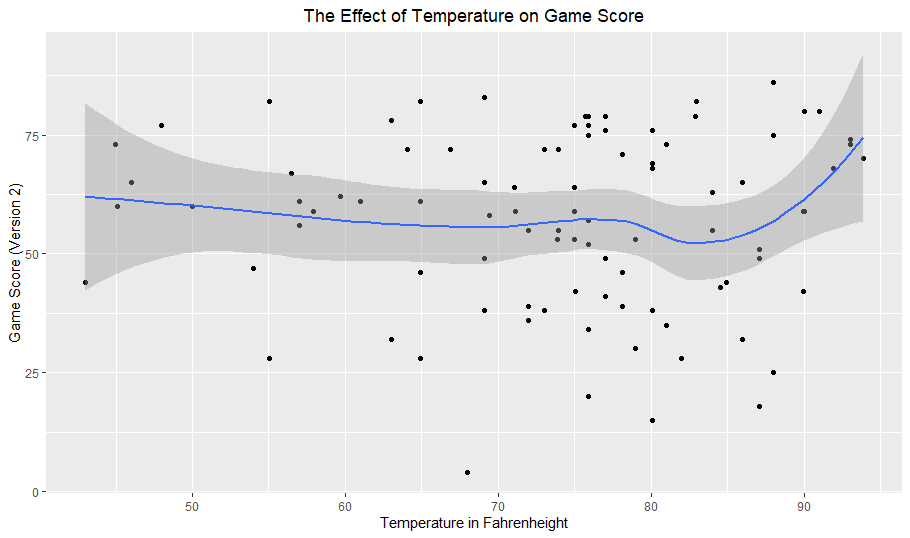
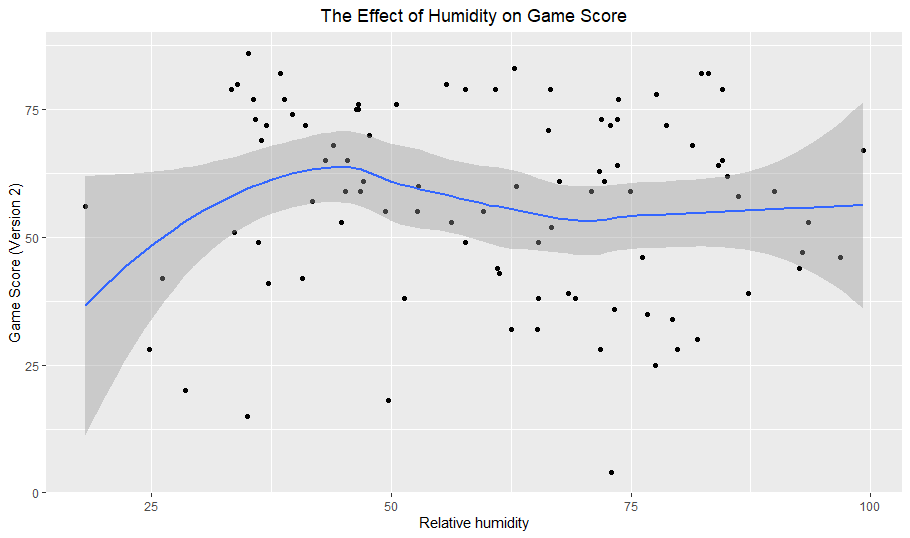
Looking at the individual effects of temperature and humidity on game score, I also do not see much here. For both graphs, I included a trend line using LOWESS smoothing, which shows the relationship between two variables without assuming a variable relationship (linear, logarithmic, etc.). For temperature, I see an increase in the trend line in the data at extreme temperatures (above 90 degrees), but the vast majority of the data has no trend. I don’t see anything in the humidity graph that would support the “Nola weather hypothesis”.
Here are the graphs for curveball spin:
There is even less of a visible relationship than the previous graphs. It seems that neither temperature nor humidity have a significant effect on curveball spin.
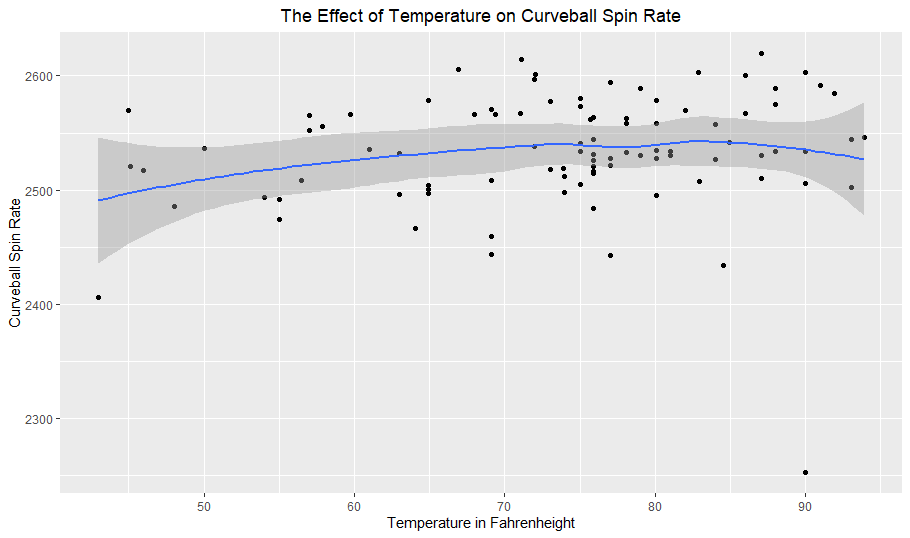
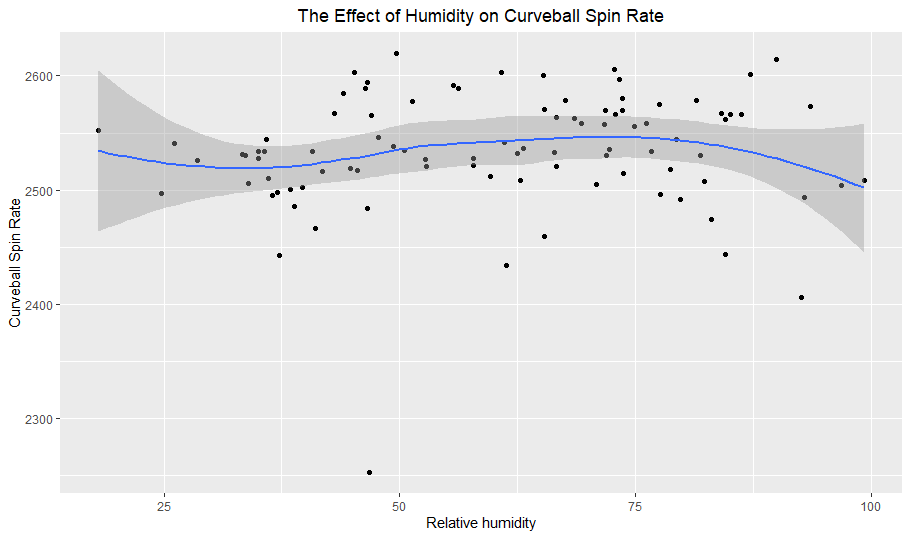
Both the trend lines and the actual data points indicate neither temperature nor humidity have an effect on curveball spin rate.
Conclusions
The data and the graphs above do not support the belief that Aaron Nola pitches better in hot and humid weather. Like I mentioned earlier, the weather data from the Iowa Environmental Mesonet does not match up with the data from wunderground, so my results could be impacted by unreliable weather data. This is an extremely important qualifier to this project as if the data is unreliable, it cannot generate any valid conclusions. However, assuming that this data is credible (and the Iowa Environmental Mesonet does appear to be a reputable data source), I found no strong evidence of weather affecting game score and curveball spin rate. There was some evidence of better game scores at temperatures above 90 degrees, but the evidence consists of less than 10 starts, so I would not draw strong conclusions from it.
Nola only pitched roughly 100 starts from 2015 through 2018, so the amount of data I worked with is limited. Perhaps with more starts and more consistent weather data, Nola would demonstrate a performance improvement in hot and humid environments. However, I suspect that while Nola might feel more comfortable pitching on warmer days, this comfort does not meaningfully boost his performance relative to other variables. Opponent quality and fatigue down the stretch, to name a few other variables, likely play a larger role in his performance variations than the weather that day.
The weather’s effect on individual player performance is complicated. While conclusions on weather conditions affecting baseball on a broader scale can be found and strongly supported (higher temperature leads to higher home run rate, for example), identifying that a player performs better under certain conditions and figuring out if there is a meaningful reason why is a more daunting task. Does the increased humidity help him grip his pitches better and improve spin rate? Or does it slow down his pitches and make them easier to hit? How much of this improved performance is noise due to small sample or related to other variables? In other words, it is difficult to draw any meaningful conclusions about weather affecting individual players, due to numerous interpretations and relatively small sample.
Future Projects
For the reasons above, I don’t plan on revisiting weather data any time soon. If I do, I would want to do some reading on the physics of baseball so I would actually know what is physically happening with the baseball. As for my next article, I plan on analyzing Aaron Nola again, but that is all I will say for now. School has been somewhat taxing and prevented me from finishing this project sooner. With winter break coming up and an easier schedule next semester, I hope to be more active on this blog. Follow me on Twitter if you want to see any of my future work. Thanks to my friends John Matthew and Srikar for looking this over.
